How to connect synapses to pre-defined spike trains#
In many cases, the user might want to simulate the voltage of a cell in response to (many) pre-defined spike trains (without actually simulating the presynaptic neurons in detail). The easiest way to achieve this in Jaxley is to define “dummy” neurons whose voltage is clamped to the pre-defined spike train.
First, generate pre-synaptic spike trains:
import numpy as np

# Generate pre-synaptic spike train.
_ = np.random.seed(42)

t_max = 1_000.0  # ms
dt = 0.025  # ms
time_steps = int(t_max // dt)

firing_rate = 30  # Hz
spike_prob = firing_rate * dt / 1000

spike_train = np.random.binomial(1, spike_prob, size=time_steps)
Next, create a network consisting of a pre-synaptic dummy neuron and the actual neuron which we want to simulate (if you want multiple pre-synaptic spike trains, then insert build multiple dummy neurons). Then, insert a synapse from the dummy neuron to the morphologically detailed cell. Lastly, clamp the voltage of the pre-synaptic dummy to the spike train:
import jaxley as jx
from jaxley.connect import connect
from jaxley.synapses import AlphaSynapse
from jaxley.channels import Leak

dummy = jx.Cell()
cell = jx.read_swc("../../tests/swc_files/morph_ca1_n120.swc", ncomp=1)
net = jx.Network([dummy, cell])
net.cell(1).insert(Leak())

# Connect pre-synaptic dummy to the morphologically detailed cell.
connect(net.cell(0), net.cell(1).branch(5).comp(0), AlphaSynapse())
net.set("AlphaSynapse_gS", 0.005)  # Synaptic strength.
net.set("AlphaSynapse_tau_decay", 5.0)  # decay time in ms

# Clamp the voltage of the pre-synaptic cell to the spike train.
net.cell(0).set("v", 0.0)  # Initial state.
net.cell(0).clamp("v", spike_train)
Added 1 external_states. See `.externals` for details.
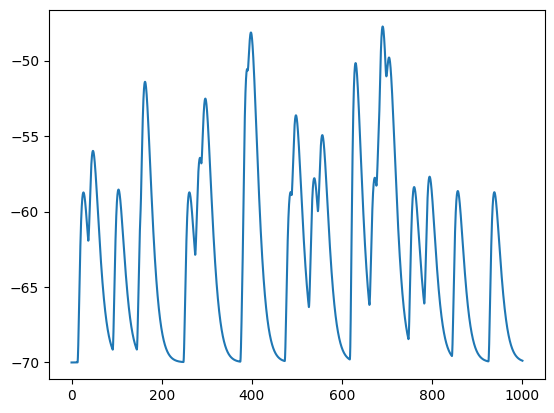
Finally, as always, insert recordings, run the simulation, and visualize the voltage response:
import matplotlib.pyplot as plt

net.cell(1).branch(5).comp(0).record()
v = jx.integrate(net, delta_t=dt)

time_vector = np.arange(0, t_max, dt)
plt.plot(time_vector, v.T)
Added 1 recordings. See `.recordings` for details.
[<matplotlib.lines.Line2D at 0x31ad344d0>]